

← Back to Blackpool Pleasure Beach
Ride details

Valhalla

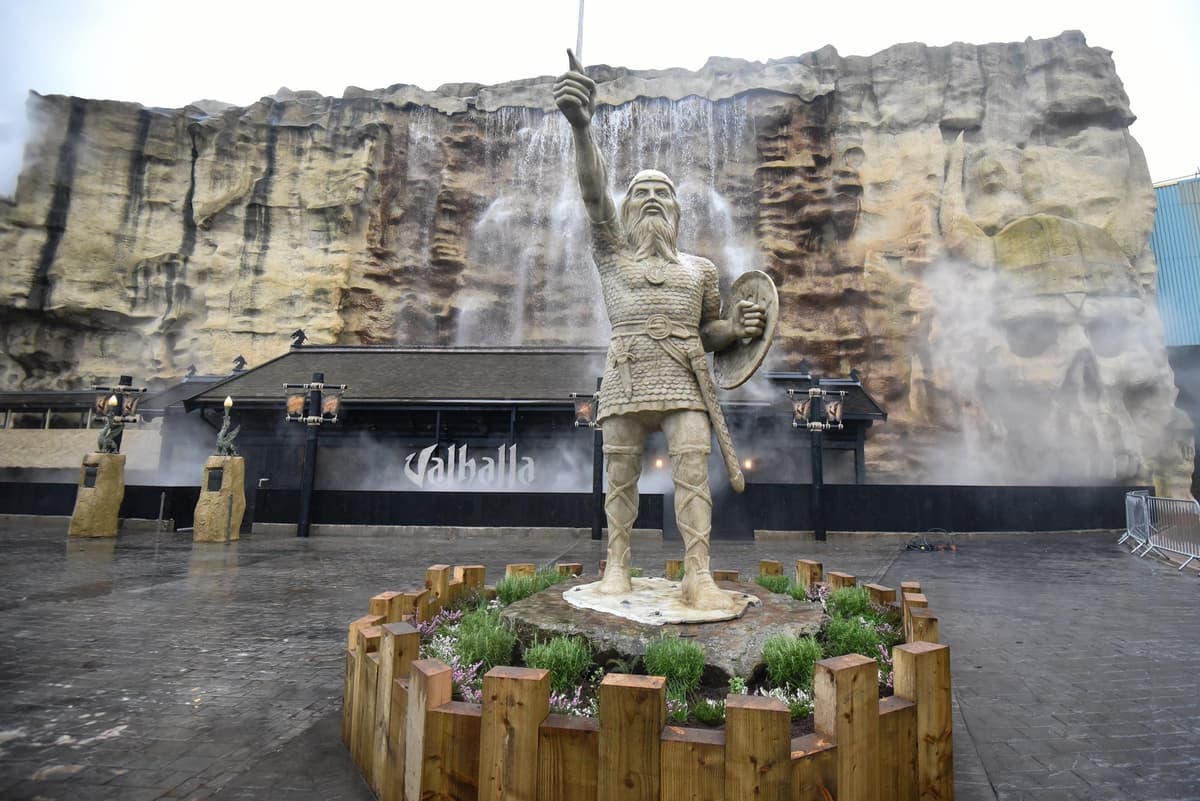
Valhalla is an indoor water dark ride from 2000 with 12 boats, 8 riders per boat and a Viking story packed with water, fire and effects.

Valhalla is the flagship water dark ride at Pleasure Beach Resort. The ride mixes a Viking saga with boat travel, drops, temperature effects, fire, water and pitch-dark scenes. After its major relaunch, the famous promise still stands: you will get wet, and you may leave absolutely drenched. Thanks to its length, scale and show value, Valhalla feels more like a full expedition than a standard splash ride.

Normal 15 min
Average 40 min
Highest measurement 160 min Measured at 16-07 14:59
Type Ride
Category Boat ride
Photos
RCDB

Coaster profile

Classification

Scale thrill
Opening 2000
Boats 12
Riders per boat 8
Building cost 15,000,000 GBP
Official award note Best Water Ride in the World for six consecutive Golden Ticket Award years
Ride length 2,624.7 ft (800.0 m)
Capacity 2000 riders per hour
Source Pleasure Beach Resort Valhalla; Dark Ride Database; Coasterpedia Valhalla

Tracks

Length 2,624.7 ft (800.0 m)
Height 78.7 ft (24.0 m)
Speed 43.5 mph (70.0 km/h)
Ride duration 4:00

Trains

Arrangement 12 Viking longboats met 4 rijen van 2 rijders, totaal 8 rijders per boot.
Trains 12
Rows per car 4
Riders per row 2
Riders per train 8
Capacity per hour 2,000

Notes

The official Valhalla page lists the year 2000, a 4-minute ride time and 12 boats with 8 riders each. Coasterpedia lists a track length of 1,985 ft, a top speed of 44 mph and capacity of 1,990 riders per hour; Dark Ride Database lists 2,625 ft, a maximum height of 79 ft, 44 mph and 2,000 riders per hour. Because the sources disagree on the length, the existing length value was not changed in this batch.

Theming

Valhalla uses Norse mythology as its framework: the boat journey takes riders past extreme elements and puts them to the test as future Viking warriors.

Data

Wait statistics

Based on available measurements and historical wait-time data.

Now Closed
Normal 15 min
Average 40 min
Highest measurement 160 min Measured at 16-07 14:59
Measurements 473
Outage measurements 83
Avg. outage duration 35 min
Often busy 12:00 70 min average
Often quiet 20:00 15 min average
Reliability High 510 measurements, 10 hour blocks
Distribution

Boxplots

Spread of wait times, outage duration, and the number of outages per day based on available historical data.

Wait times

473 measurements

0 min 40 min 80 min 120 min 160 min
Min
0 min
Q1
20 min
Median
35 min
Q3
60 min
Max
160 min

Typical wait time: around 35 min.

It usually falls between 20 min and 60 min.

See more than 60 min? It is probably busier than usual — consider a quieter moment.

Less than 20 min? You are in luck: that does not happen often.

Outage duration

18 outages

0 min 50 min 100 min 150 min 200 min
Min
1 min
Q1
5 min
Median
13 min
Q3
34 min
Max
167 min

Outages usually last about 13 min.

Some are over quickly (sometimes within 5 min), others take longer (up to 34 min). That varies per outage.

Already longer than 34 min? The attraction may stay closed a while longer.

Outages per day

9 days

0 1 2
Min
2
Q1
2
Median
2
Q3
2
Max
2

On days with outages, we see an average of 2 per day.

That usually falls between 2 and 2.

On quiet days it was 2, on busy days up to 2.

Historical

Wait-time build-up

Today compared with historical wait times by hour.

Today Expected Historical
Horizontal axis hours, vertical axis queue minutes. 0 min 20 min 40 min 60 min 80 min 10:00 12:00 14:00 16:00 18:00 20:00 21:00