

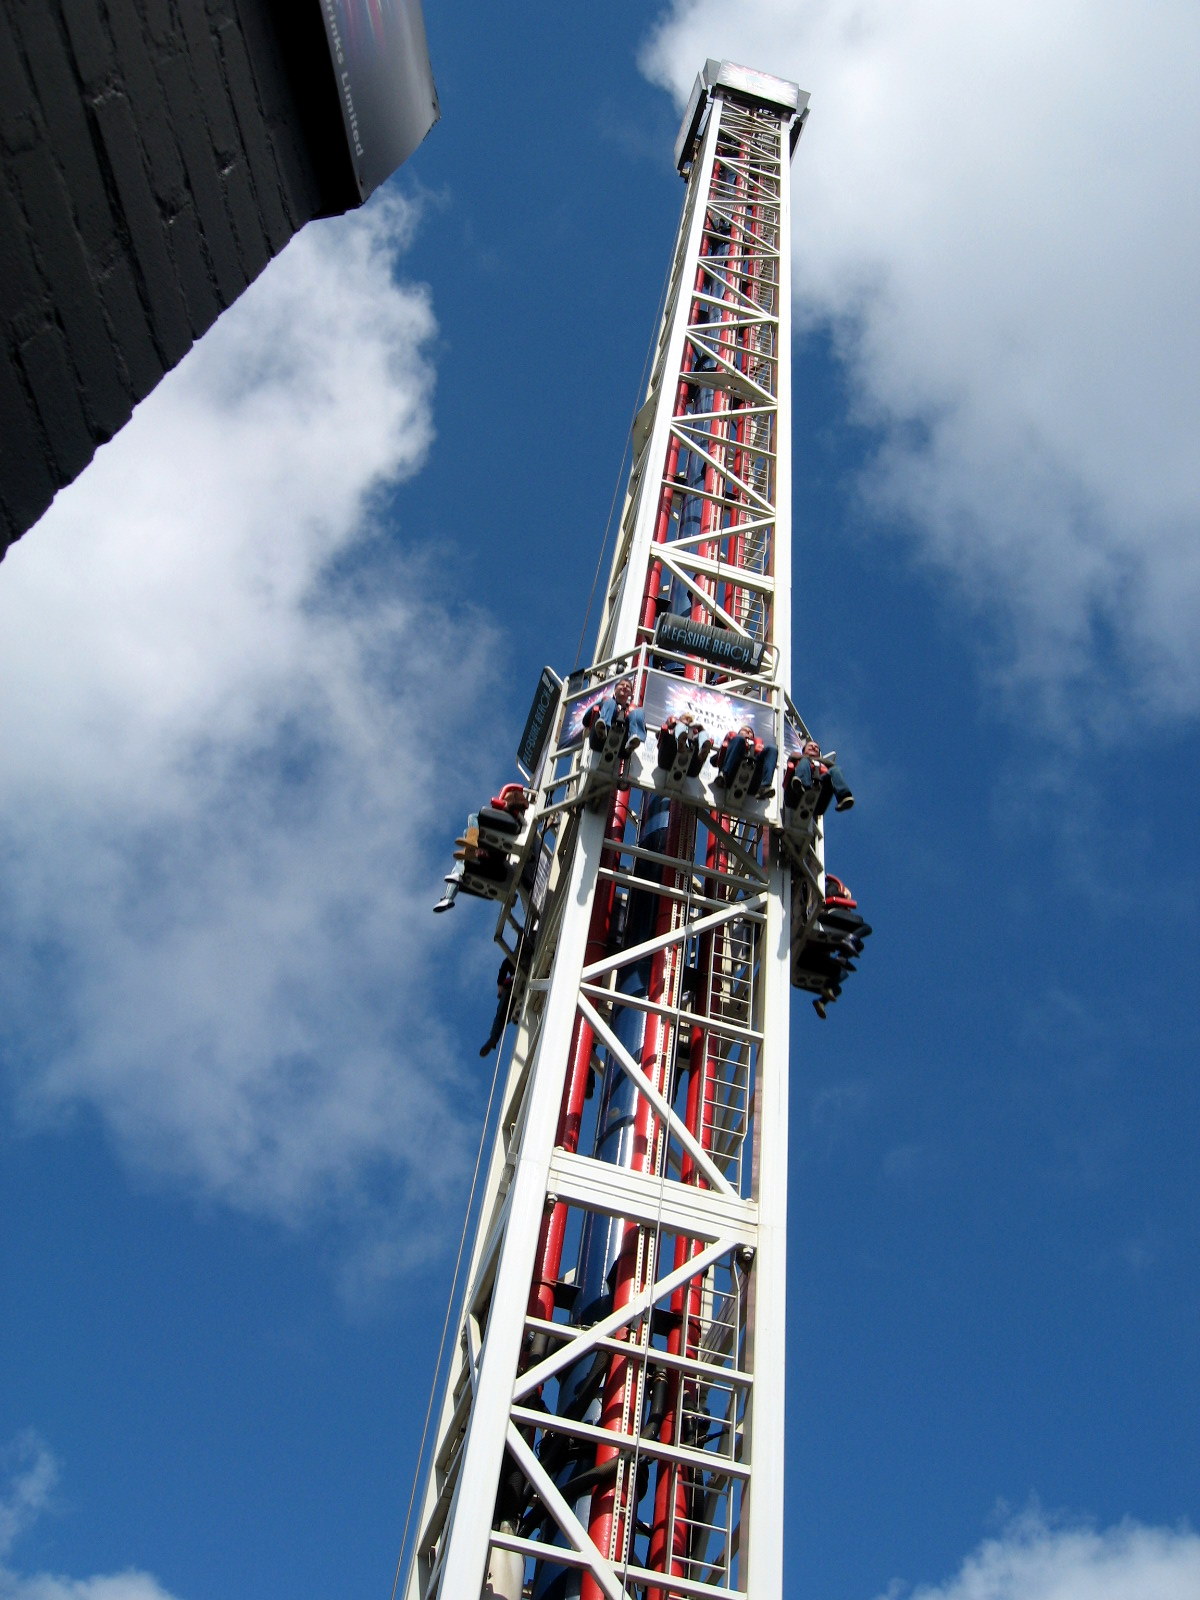
Photo 1 of Launch Pad
← Back to Blackpool Pleasure Beach
Ride details

Launch Pad

Launch Pad is a 1997 S&S Shot Tower, reimagined in 2025, with a 210-foot launch and a top speed of 80 mph.

Launch Pad is the reimagined shot tower at Blackpool Pleasure Beach. The ride was previously known as PlayStation: The Ride and later Ice Blast, before receiving a space theme and a stronger presentation in 2025. With 12 riders per launch, the gondola shoots straight up, delivers a burst of weightlessness and then drops back fast above the seafront.

Normal 20 min
Average 23 min
Highest measurement 90 min Measured at 14-07 12:23
Type Ride
Category Drop Tower
Photos
RCDB

Coaster profile

Classification

Scale extreme
Opening 1997
Re-imagined 2025
Former name PlayStation: The Ride
Former name Ice Blast
Official height 210.0 ft (64.0 m)
Official top speed 80.0 mph (128.7 km/h)
Capacity per launch 12 riders
Source Pleasure Beach Resort Launch Pad; Blooloop; Coasterpedia Launch Pad

Tracks

Height 210.0 ft (64.0 m)
Speed 80.0 mph (128.7 km/h)

Trains

Arrangement Een pneumatische S&S shot tower gondel met twaalf rijders per lancering.
Trains 1
Riders per train 12

Notes

The official Launch Pad page lists a height of 210 feet, a top speed of 80 mph, 12 riders per launch and the label reimagined 2025. Coasterpedia cites a 1997 opening and the former names PlayStation: The Ride and Ice Blast.

Theming

Since 2025, Launch Pad has leaned fully into a space-launch theme, with a new name, new colours and a show moment built around the vertical launch.

Data

Wait statistics

Based on available measurements and historical wait-time data.

Now No data
Normal 20 min
Average 23 min
Highest measurement 90 min Measured at 14-07 12:23
Measurements 2730
Outage measurements 9
Avg. outage duration 14 min
Often busy 20:00 38 min average
Often quiet 00:00 15 min average
Reliability High 2641 measurements, 13 hour blocks
Distribution

Boxplots

Spread of wait times, outage duration, and the number of outages per day based on available historical data.

Wait times

2730 measurements

0 min 25 min 50 min 75 min 100 min
Min
0 min
Q1
15 min
Median
20 min
Q3
30 min
Max
90 min

Typical wait time: around 20 min.

It usually falls between 15 min and 30 min.

See more than 30 min? It is probably busier than usual — consider a quieter moment.

Less than 15 min? You are in luck: that does not happen often.

Outage duration

4 outages

0 min 10 min 20 min 30 min
Min
5 min
Q1
5 min
Median
13 min
Q3
22 min
Max
26 min

On average, an outage lasts about 13 min.

In three out of four cases, the attraction reopens within 22 min.

If it takes longer, expect extra waiting time.

Outages per day

1 day

0 1 2 3 4
Min
4
Q1
4
Median
4
Q3
4
Max
4

On days with outages, we see an average of 4 per day.

That usually falls between 4 and 4.

On quiet days it was 4, on busy days up to 4.

Historical

Wait-time build-up

Today compared with historical wait times by hour.

Today Expected Historical
Horizontal axis hours, vertical axis queue minutes. 0 min 10 min 20 min 30 min 40 min 00:00 03:00 06:00 09:00 12:00 15:00 18:00 21:00