

← Back to Blackpool Pleasure Beach
Ride details

Flying Machines

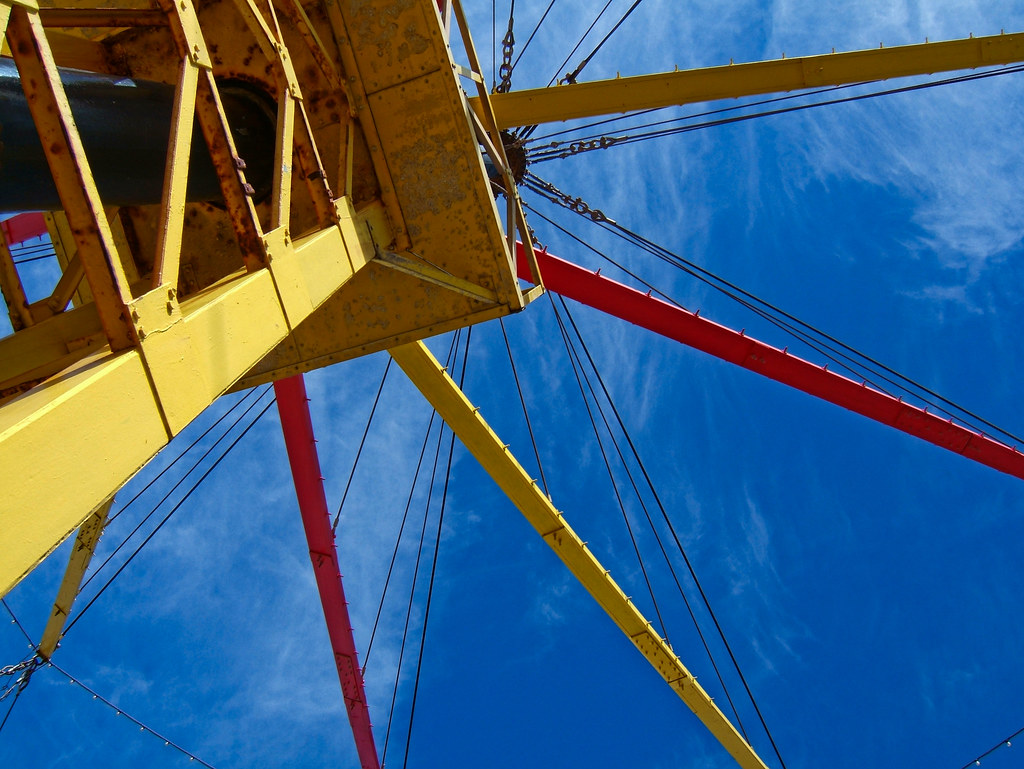
Sir Hiram Maxim's Flying Machines is a working flying-machine attraction from 1904 and a Grade II listed landmark at Pleasure Beach Resort.

Sir Hiram Maxim's Flying Machines feels less like a standard family ride and more like a living piece of amusement-park history. The suspended vehicles circle a central structure and recreate early dreams of flight from long before flying became ordinary. That is exactly why the attraction still stands out: you are riding through an idea from the dawn of aviation.

Normal 10 min
Average 9 min
Highest measurement 40 min Measured at 13-07 15:02
Type Ride
Category Aerial Ride
Photos
RCDB

Coaster profile

Classification

Scale low
Opening 1 augustus 1904
Heritage status Grade II listed building
Eerste listing 19 april 2017
Product Flying Machine
Armen 10
Diameter 45.0 ft (13.7 m)
Motoren 2 x 50 hp
Toevoegingen Joseph Emberton, 1934
Minimumlengte zelfstandig 117 cm
Bronnen Pleasure Beach Resort; Historic England; Coasterpedia; Wikipedia

Trains

Arrangement Hangende vliegvoertuigen draaien rond een centrale aandrijving; exact aantal operationele voertuigen en zitplaatsen wordt niet als actuele parkwaarde gepubliceerd.

Notes

Pleasure Beach Resort lists 0 cm when accompanied and 3 ft 10 in for solo riding on Flying Machines. Coasterpedia identifies the attraction as Sir Hiram Maxim's Captive Flying Machine, opening on August 1, 1904. Historic England describes the Grade II listed ride as a 1904 amusement attraction with an elevated timber boarding platform wrapped around a central vertical drive shaft.

Theming

The ride is built around the early dream of controlled flight, letting visitors glide in suspended machines around a central mast.

Data

Wait statistics

Based on available measurements and historical wait-time data.

Now Closed
Normal 10 min
Average 9 min
Highest measurement 40 min Measured at 13-07 15:02
Measurements 1252
Outage measurements 13
Avg. outage duration 51 min
Often busy 12:00 10 min average
Often quiet 10:00 5 min average
Reliability High 1248 measurements, 12 hour blocks
Distribution

Boxplots

Spread of wait times, outage duration, and the number of outages per day based on available historical data.

Wait times

1252 measurements

0 min 10 min 20 min 30 min 40 min
Min
0 min
Q1
5 min
Median
10 min
Q3
10 min
Max
40 min

Typical wait time: around 10 min.

It usually falls between 5 min and 10 min.

See more than 10 min? It is probably busier than usual — consider a quieter moment.

Less than 5 min? You are in luck: that does not happen often.

Outage duration

2 outages

0 min 25 min 50 min 75 min 100 min
Min
20 min
Q1
36 min
Median
51 min
Q3
67 min
Max
82 min

On average, an outage lasts about 51 min.

In three out of four cases, the attraction reopens within 67 min.

If it takes longer, expect extra waiting time.

Outages per day

1 day

0 1 2
Min
2
Q1
2
Median
2
Q3
2
Max
2

On days with outages, we see an average of 2 per day.

That usually falls between 2 and 2.

On quiet days it was 2, on busy days up to 2.

Historical

Wait-time build-up

Today compared with historical wait times by hour.

Today Expected Historical
Horizontal axis hours, vertical axis queue minutes. 0 min 5 min 10 min 15 min 20 min 10:00 12:00 14:00 16:00 18:00 20:00 21:00