

← Back to Blackpool Pleasure Beach
Ride details

Avalanche

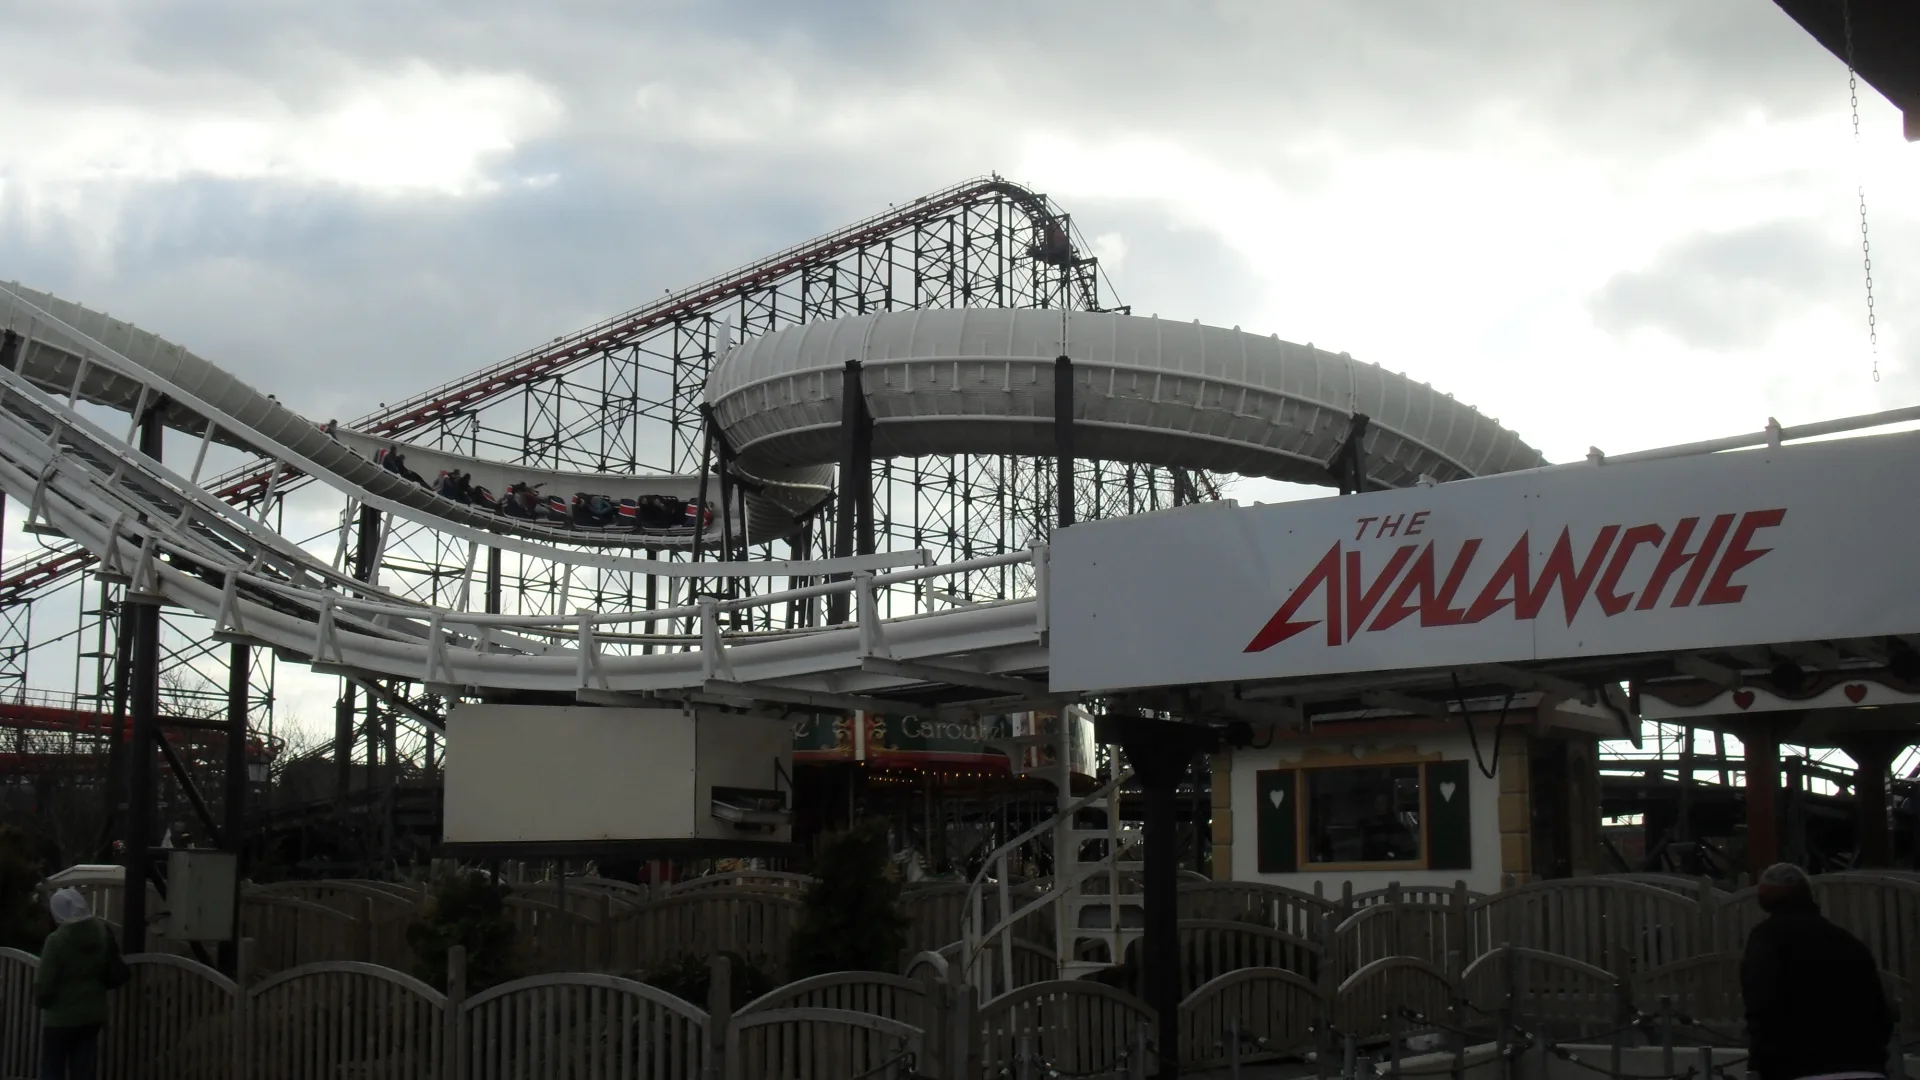
Avalanche is Pleasure Beach Resort's Mack bobsled coaster, where the train slides freely downhill through a steel trough.

Avalanche feels different from a classic coaster because the train is not rigidly locked to the track. After the lift, the bobsled picks its own line through the wide trough, mixing quick turns with a winter-sports theme that still suits the compact but punchy ride.

Normal 20 min
Average 31 min
Highest measurement 120 min Measured at 15-07 13:22
Type Ride
Category Roller coaster
Photos
RCDB

Coaster profile

View on RCDB

Classification

RCDB #789
RCDB status Operating since June 22, 1988
Classification Roller Coaster
Track type Steel
Design Bobsled
Scale Thrill
Categories Roller Coaster, Steel, Bobsled, Thrill
G-force 2.9G
UK first First bobsled coaster in the United Kingdom
Unaccompanied minimum 132 cm

Tracks

Length 1,490.0 ft (454.2 m)
Height 59.1 ft (18.0 m)
Speed 45.0 mph (72.4 km/h)
Inversions 0
Ride duration 1:22

Trains

Arrangement 3 treinen met 7 wagens per trein; rijders zitten achter elkaar in 2 rijen, samen 14 rijders per trein.
Trains 3
Cars per train 7
Rows per car 2
Riders per row 1
Riders per train 14

Location

Pleasure Beach Resort

Notes

RCDB lists Mack Rides GmbH & Co KG as the manufacturer, the Bobsled / Custom model, a 1,490-foot track, zero inversions, a 1:22 ride time and three trains seating 14 riders each. Coasterpedia and Wikipedia add a 59-foot height, a top speed of 45 mph and an opening date of June 22, 1988.

Theming

Alpine bobsled styling with a lodge-like station atmosphere and trains shaped like bobsleds.

Data

Wait statistics

Based on available measurements and historical wait-time data.

Now Closed
Normal 20 min
Average 31 min
Highest measurement 120 min Measured at 15-07 13:22
Measurements 1184
Outage measurements 11
Avg. outage duration 14 min
Often busy 12:00 30 min average
Often quiet 19:00 15 min average
Reliability High 1252 measurements, 12 hour blocks
Distribution

Boxplots

Spread of wait times, outage duration, and the number of outages per day based on available historical data.

Wait times

1184 measurements

0 min 30 min 60 min 90 min 120 min
Min
0 min
Q1
20 min
Median
30 min
Q3
40 min
Max
120 min

Typical wait time: around 30 min.

It usually falls between 20 min and 40 min.

See more than 40 min? It is probably busier than usual — consider a quieter moment.

Less than 20 min? You are in luck: that does not happen often.

Outage duration

5 outages

0 min 10 min 20 min 30 min 40 min
Min
5 min
Q1
6 min
Median
6 min
Q3
16 min
Max
36 min

Outages usually last about 6 min.

Some are over quickly (sometimes within 6 min), others take longer (up to 16 min). That varies per outage.

Already longer than 16 min? The attraction may stay closed a while longer.

Outages per day

3 days

0 1 2
Min
1
Q1
2
Median
2
Q3
2
Max
2

On days with outages, we see an average of 2 per day.

That usually falls between 2 and 2.

On quiet days it was 1, on busy days up to 2.

Historical

Wait-time build-up

Today compared with historical wait times by hour.

Today Expected Historical
Horizontal axis hours, vertical axis queue minutes. 0 min 10 min 20 min 30 min 10:00 12:00 14:00 16:00 18:00 20:00 21:00