

← Back to Bellewaerde
Ride details

Niagara

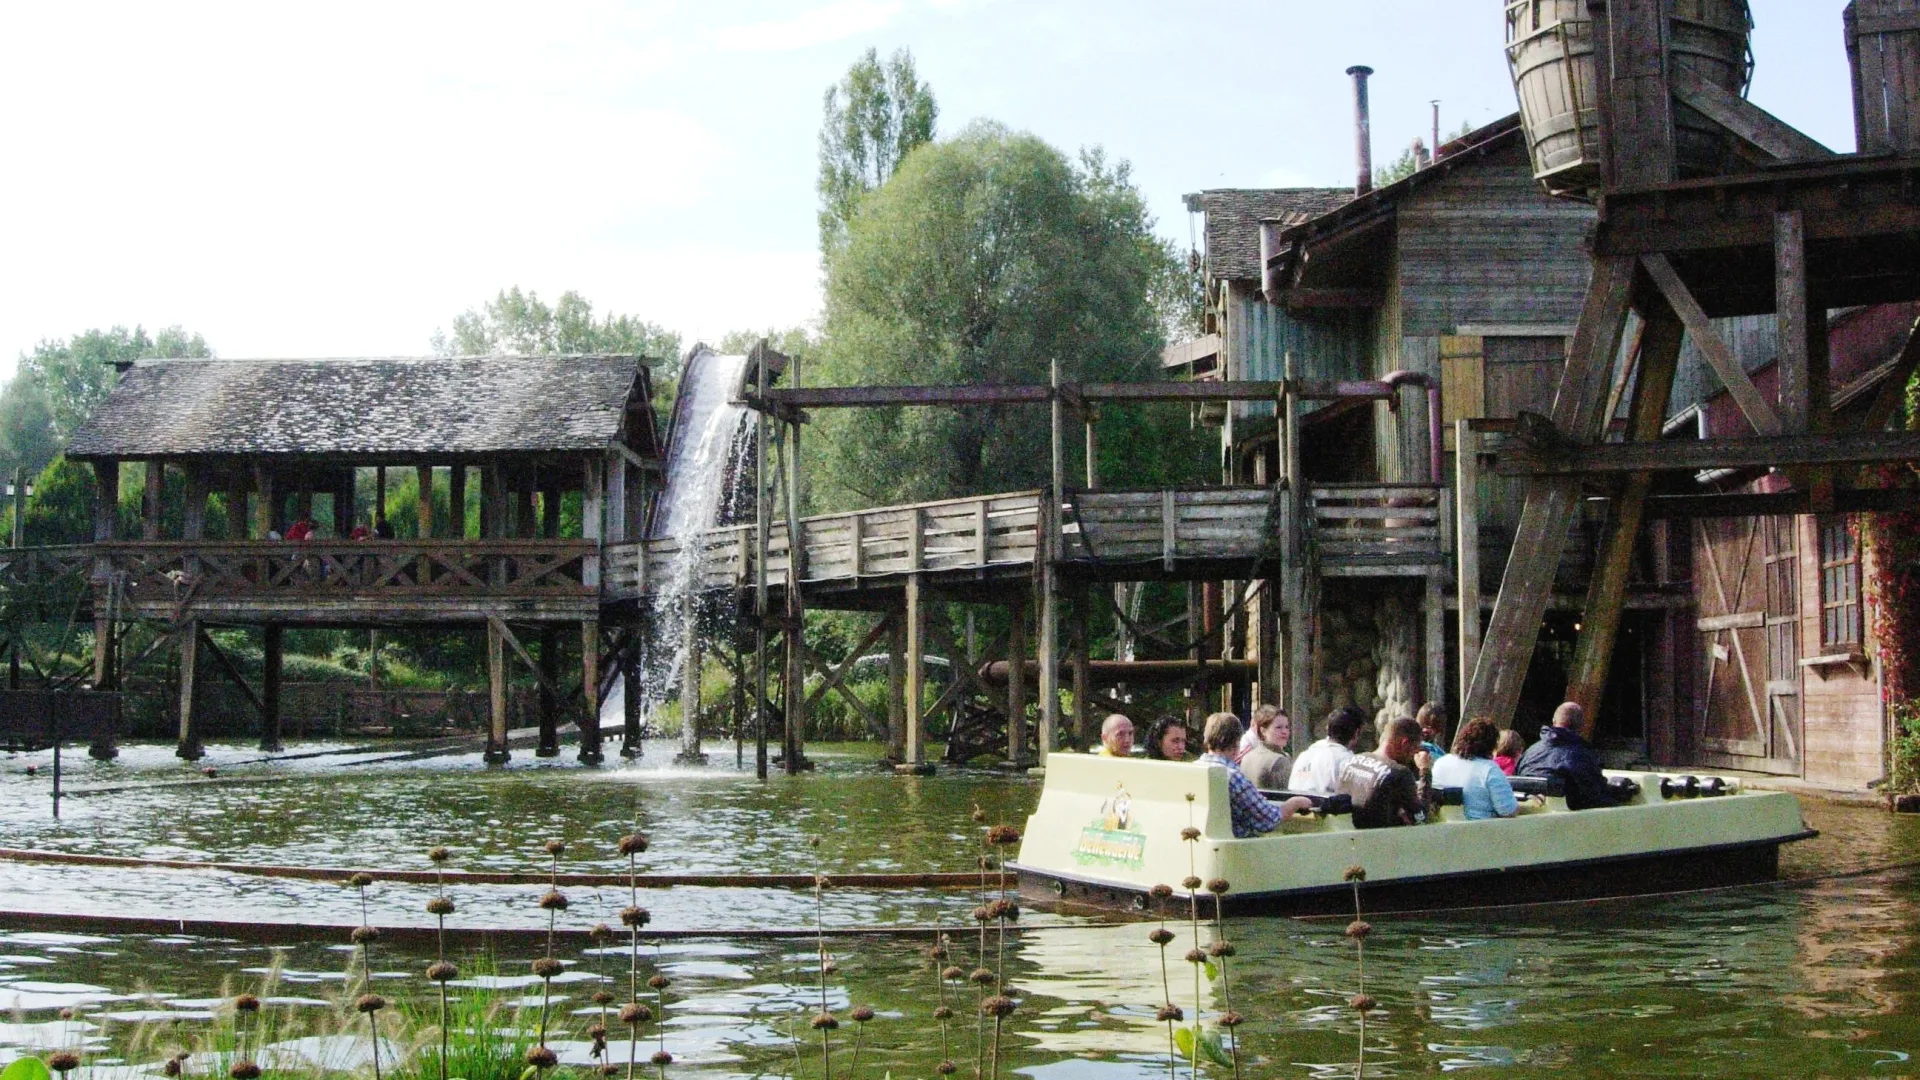
Niagara is Bellewaerde's large Shoot-the-Chute water ride in Canada, with a 66-foot drop and a huge splash.

Niagara is one of Bellewaerde's wettest classics. The large boat climbs to 66 feet, gently turns at the top and then dives straight into the water. The splash is part of the experience: riders get soaked, and visitors on the bridge can step right into the wave if they want to.

Normal 5 min
Average 9 min
Highest measurement 155 min Measured at 24-06 12:32
Type Ride
Category Log flume
Photos
RCDB

Coaster profile

Classification

Scale family
Ride type Shoot the Chute
Opened August 1, 1995
Height 65.6 ft (20.0 m)
Length 787.4 ft (240.0 m)
Duration 5 min 00 sec
Capacity 1200 riders per hour
Minimum unaccompanied height 120 cm
Sources Bellewaerde; Interlink LG; Pretparken.be; Wikipedia

Tracks

Length 787.4 ft (240.0 m)
Height 65.6 ft (20.0 m)
Ride duration 5:00

Trains

Arrangement Grote Shoot-the-Chute-boten varen per cyclus door de waterbaan; exact aantal boten en zitplaatsen is niet als officiele Bellewaerde-waarde gepubliceerd.
Capacity per hour 1,200

Location

Niagara sits in the Canada area and has a bridge by the splash zone where onlookers can get drenched on purpose.

Notes

Bellewaerde lists a minimum height of 2.95 feet, 3.94 feet to ride alone, a height of 66 feet, opening year 1995 and the Canada location. Pretparken.be mentions Interlink, Shoot the Chute, a length of 787 feet and a ride time of 5 minutes. Interlink supports the 66-foot profile and 1,200 riders per hour; we have not yet confirmed an exact opening day.

Theming

The name and presentation point to mighty waterfalls: the buildup is all about the view from above and a wide, spectacular splash.

Data

Wait statistics

Based on available measurements and historical wait-time data.

Now Closed
Normal 5 min
Average 9 min
Highest measurement 155 min Measured at 24-06 12:32
Measurements 1214
Outage measurements 0
Avg. outage duration -
Often busy 15:00 10 min average
Often quiet 11:00 5 min average
Reliability High 1239 measurements, 11 hour blocks
Distribution

Boxplots

Spread of wait times, outage duration, and the number of outages per day based on available historical data.

Wait times

1214 measurements

0 min 40 min 80 min 120 min 160 min
Min
5 min
Q1
5 min
Median
5 min
Q3
10 min
Max
155 min

Typical wait time: around 5 min.

It usually falls between 5 min and 10 min.

See more than 10 min? It is probably busier than usual — consider a quieter moment.

Less than 5 min? You are in luck: that does not happen often.

Outage duration

Not enough data yet for a boxplot.

This attraction has not reported any outages to us yet. We cannot say anything meaningful about it here.

Outages per day

Not enough data yet for a boxplot.

This attraction has not reported any outages to us yet. We cannot say anything meaningful about it here.

Historical

Wait-time build-up

Today compared with historical wait times by hour.

Today Expected Historical
Horizontal axis hours, vertical axis queue minutes. 0 min 5 min 10 min 15 min 20 min 10:00 12:00 14:00 16:00 18:00 20:00 22:00