

← Back to Alton Towers
Ride details

Skyride to Towers St. (From Forbidden Valley)

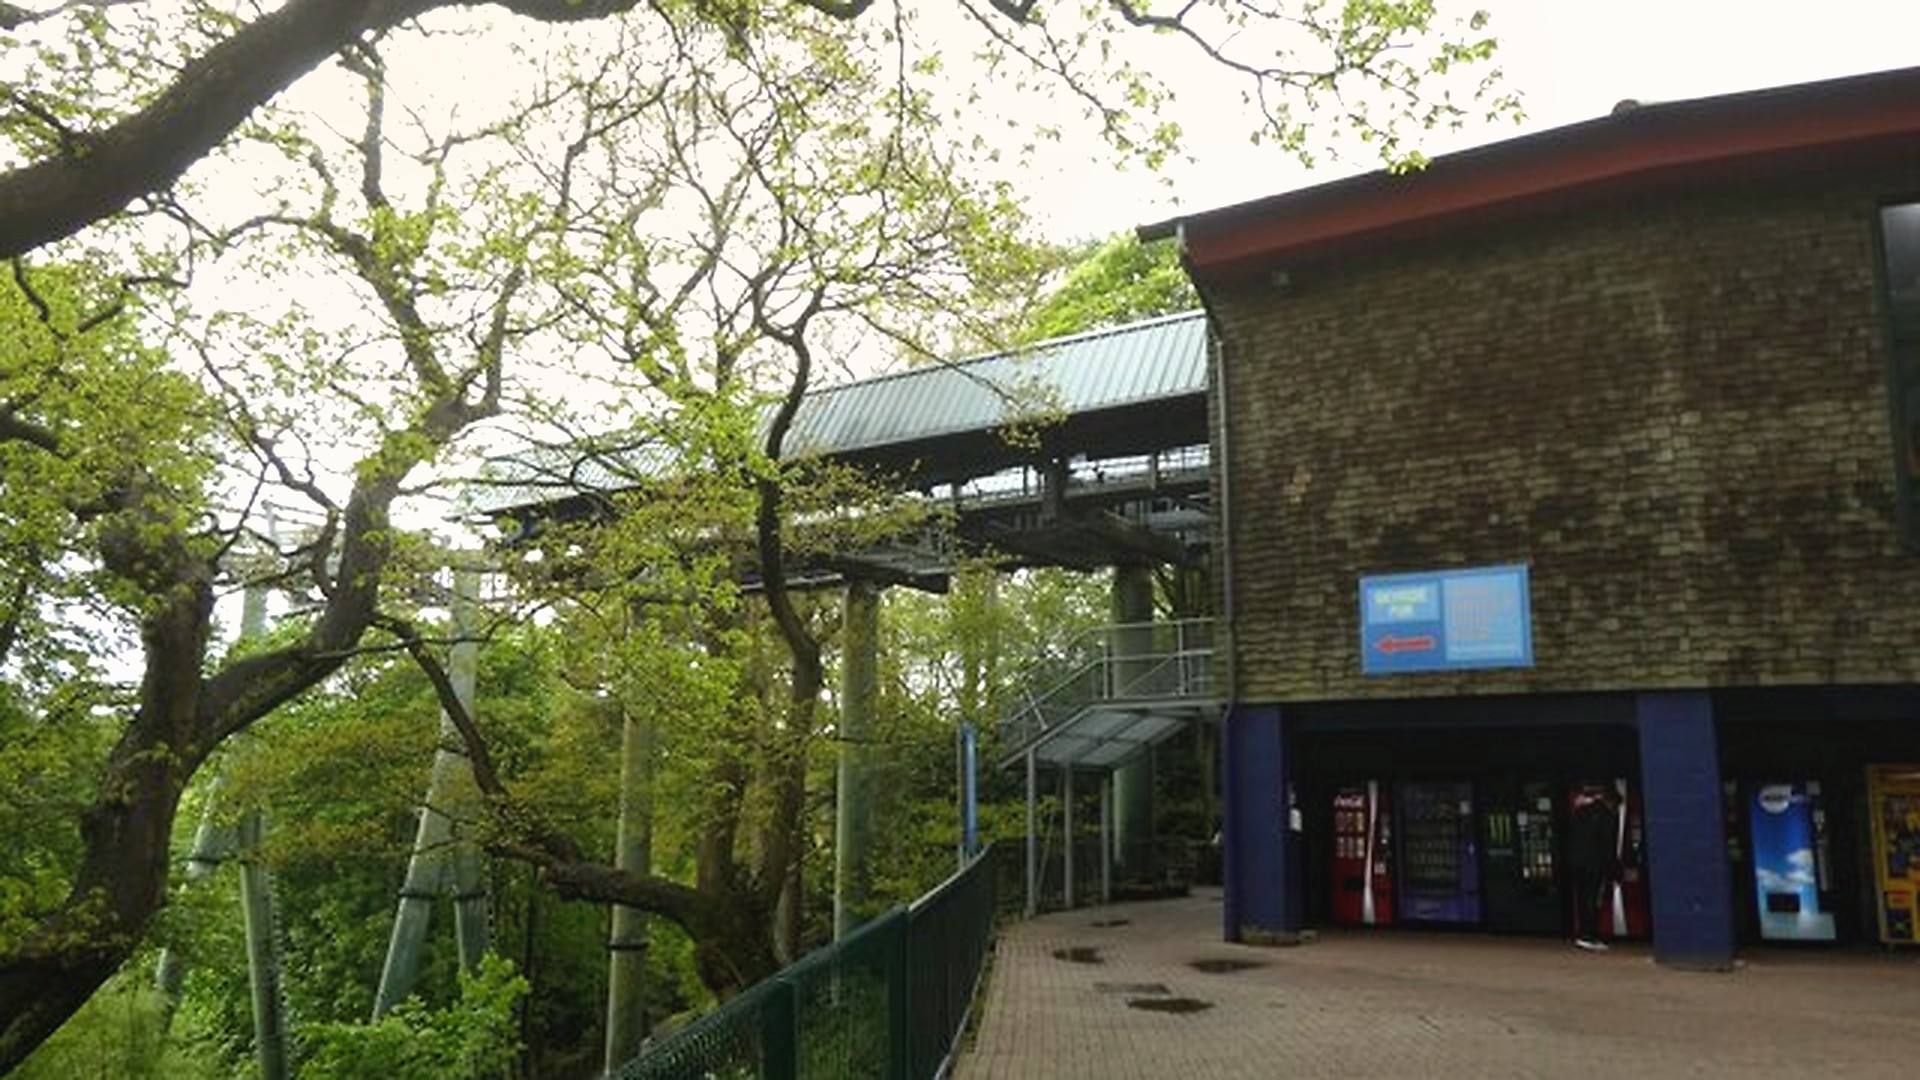
Skyride is Alton Towers' gondola lift and links Forbidden Valley with Towers Street, among other stations.

Skyride doubles as transport and a scenic break. The gondolas glide above the valley and Alton Towers' gardens, turning the ride into a calm pause between the park's bigger attraction areas.

Normal 5 min
Average 5 min
Highest measurement 20 min Measured at 05-07 14:17
Type Ride
Category Transport
Photos
RCDB

Coaster profile

Classification

Scale low
Attractietype Ropeway / gondola lift
Stations Towers Street, Forbidden Valley, Fountain Square
Reistijd ongeveer 5 minuten per traject
Heropening Na Renovatie 3 mei 2025
Bronnen Alton Towers support; Alton Towers height restrictions; Coasterpedia Skyride; TowersTimes Skyride

Tracks

Length 3,438.3 ft (1,048.0 m)
Height 200.1 ft (61.0 m)
Ride duration 5:00

Trains

Arrangement 52 POMA-gondels; per gondel kunnen maximaal 10 rijders mee.
Trains 52
Riders per train 10

Location

Skyride has stations at Towers Street, Forbidden Valley and Fountain Square; this profile covers the route from Forbidden Valley to Towers Street.

Notes

TowersTimes lists Poma, Gondola Lift, an opening date of March 28, 1987, a length of 3,438 ft, a maximum height of 200 ft, 52 gondolas, 10 passengers per gondola and a ride time of 5:00. The cable car links Towers Street, Forbidden Valley and The Towers; this directional profile describes the trip from Forbidden Valley to Towers Street. Coasterpedia also confirms POMA, 1987 and 10 passengers per gondola.

Theming

The attraction does not lean on a strong story, but the views across the historic gardens make the transfer part of the park experience.

Data

Wait statistics

Based on available measurements and historical wait-time data.

Now Closed
Normal 5 min
Average 5 min
Highest measurement 20 min Measured at 05-07 14:17
Measurements 568
Outage measurements 0
Avg. outage duration -
Often busy 11:00 5 min average
Often quiet 11:00 5 min average
Reliability High 643 measurements, 7 hour blocks
Distribution

Boxplots

Spread of wait times, outage duration, and the number of outages per day based on available historical data.

Wait times

568 measurements

0 min 5 min 10 min 15 min 20 min
Min
5 min
Q1
5 min
Median
5 min
Q3
5 min
Max
20 min

Typical wait time: around 5 min.

It usually falls between 5 min and 5 min.

See more than 5 min? It is probably busier than usual — consider a quieter moment.

Less than 5 min? You are in luck: that does not happen often.

Outage duration

Not enough data yet for a boxplot.

This attraction has not reported any outages to us yet. We cannot say anything meaningful about it here.

Outages per day

Not enough data yet for a boxplot.

This attraction has not reported any outages to us yet. We cannot say anything meaningful about it here.

Historical

Wait-time build-up

Today compared with historical wait times by hour.

Today Historical
Horizontal axis hours, vertical axis queue minutes. 0 min 5 min 10 min 15 min 20 min 10:00 11:00 12:00 13:00 14:00 15:00 16:00 17:00 18:00