← Back to Alton Towers
Ride details

Nemesis Sub-Terra

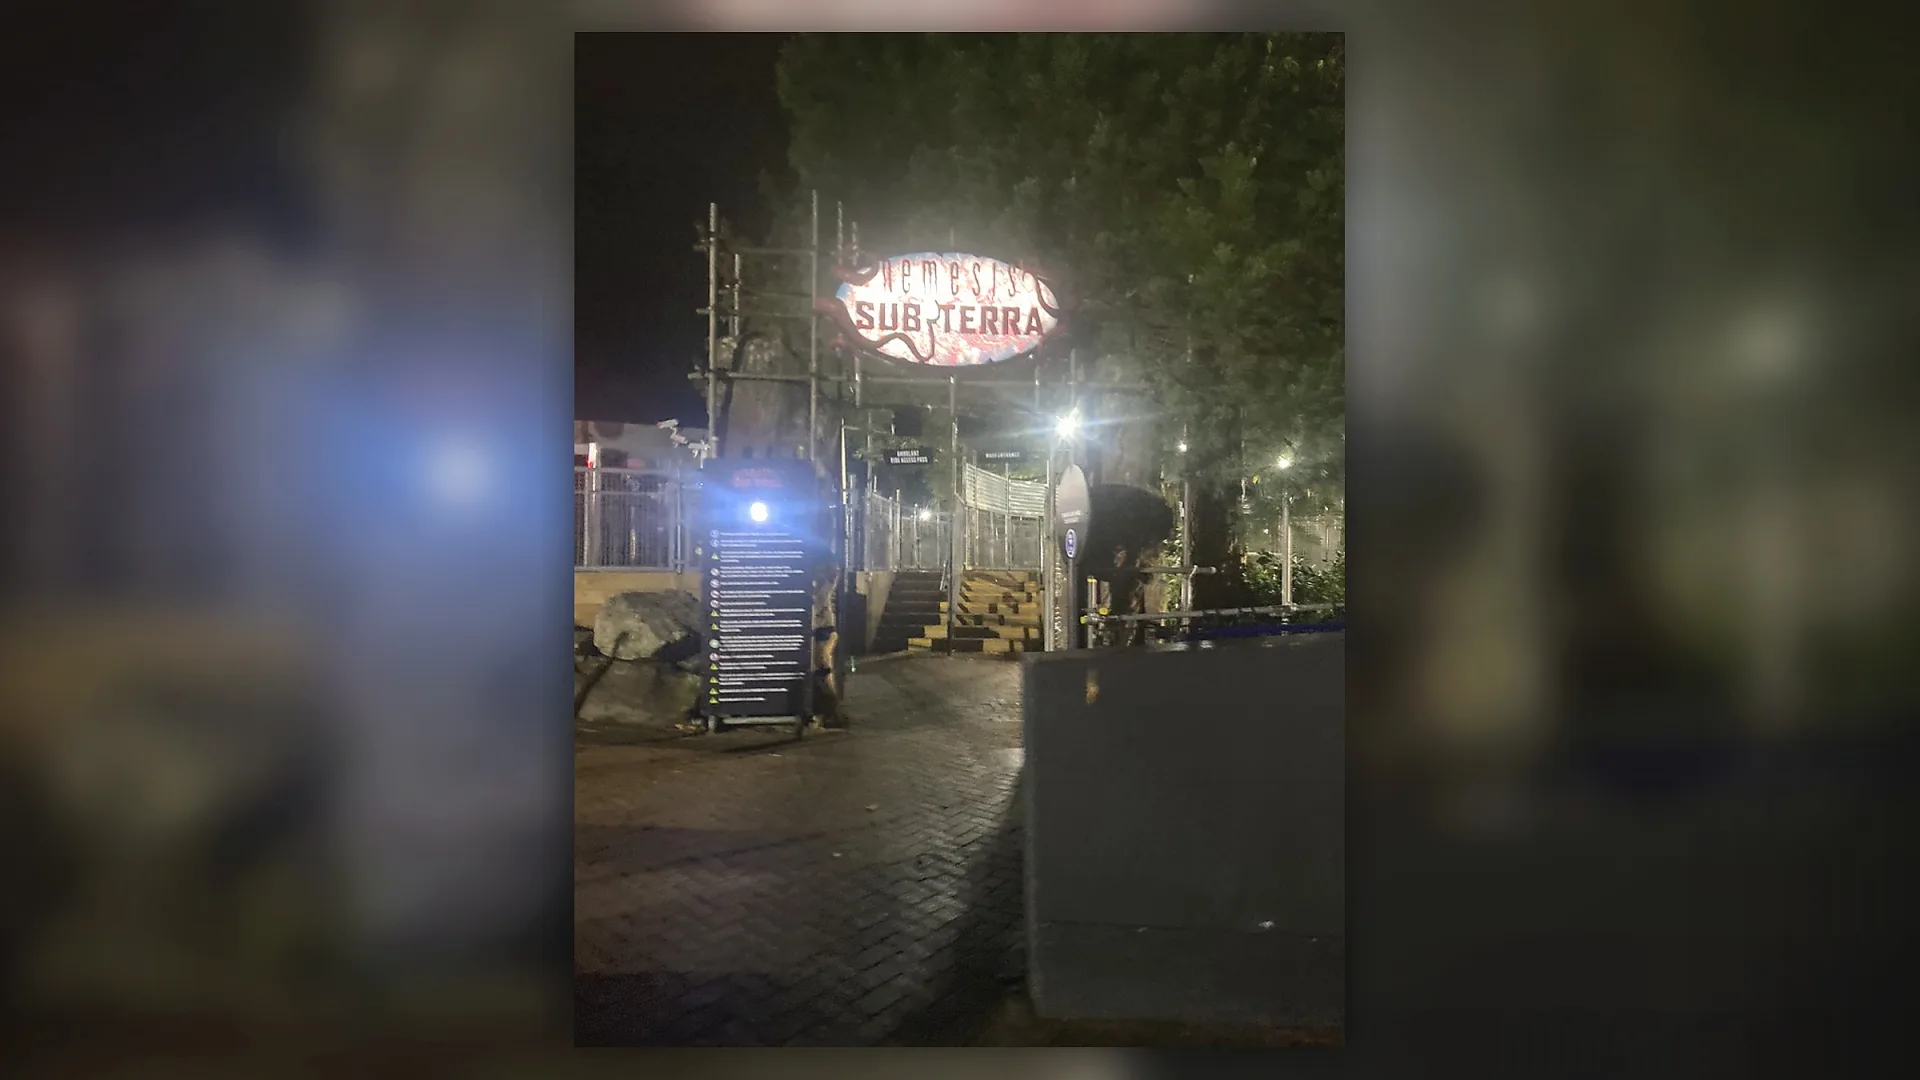
Nemesis Sub-Terra is a dark ABC Rides drop tower in Forbidden Valley that takes the Nemesis story underground.

Nemesis Sub-Terra is more than a bare drop tower. Guests descend into a Phalanx facility where the Nemesis story plays out through darkness, tension, effects and a short drop. The attraction works best because you never quite know what is happening inside the bunker.

Normal 8 min
Average 12 min
Highest measurement 50 min Measured at 16-07 12:01
Type Ride
Category Dark Ride
Photos
RCDB

Coaster profile

Classification

Scale thrill
Cost 5000000 GBP
G-force 4.5G
SBNO late 2015-2023
Reopened 27 May 2023
Drop towers 4

Tracks

Height 19.7 ft (6.0 m)
Drop 23.0 ft (7.0 m)
Speed 26.7 mph (43.0 km/h)
Ride duration 3:00

Trains

Arrangement Viewing chamber met 4 zitsecties van 10 stoelen; per showmoment kunnen 40 gasten plaatsnemen.
Trains 4
Rows per car 1
Riders per row 10
Riders per train 40
Capacity per hour 1,200

Location

Nemesis Sub-Terra sits in Forbidden Valley beneath the story world of Nemesis Reborn.

Notes

TowersTimes lists ABC Rides Drop Tower, an opening on 24 March 2012, a reopening on 27 May 2023, a 23-foot drop, 1,200 riders per hour and a 3-minute duration. The experience includes Phalanx pre-shows, a lift simulation, a seated drop around the Nemesis egg and an evacuation and decontamination scene. Coasterpedia also confirms ABC Rides Free Fall Tower and the 24 March 2012 opening; capacity figures vary, so the previously used TowersTimes capacity remains in place.

Theming

A Forbidden Valley dark ride built around Phalanx, underground Nemesis containment and an alien egg at the centre of the story.


Data

Wait statistics

Based on available measurements and historical wait-time data.

Now Closed
Normal 8 min
Average 12 min
Highest measurement 50 min Measured at 16-07 12:01
Measurements 1119
Outage measurements 0
Avg. outage duration -
Often busy 12:00 16 min average
Often quiet 11:00 5 min average
Reliability High 1207 measurements, 7 hour blocks
Distribution

Boxplots

Spread of wait times, outage duration, and the number of outages per day based on available historical data.

Wait times

1119 measurements

0 min 15 min 30 min 45 min 60 min
Min
5 min
Q1
5 min
Median
10 min
Q3
15 min
Max
50 min

Typical wait time: around 10 min.

It usually falls between 5 min and 15 min.

See more than 15 min? It is probably busier than usual — consider a quieter moment.

Less than 5 min? You are in luck: that does not happen often.

Outage duration

Not enough data yet for a boxplot.

This attraction has not reported any outages to us yet. We cannot say anything meaningful about it here.

Outages per day

Not enough data yet for a boxplot.

This attraction has not reported any outages to us yet. We cannot say anything meaningful about it here.

Historical

Wait-time build-up

Today compared with historical wait times by hour.

Today Expected Historical
Horizontal axis hours, vertical axis queue minutes. 0 min 5 min 10 min 15 min 20 min 10:00 11:00 12:00 13:00 14:00 15:00 16:00 17:00 18:00