← Back to Alton Towers
Ride details

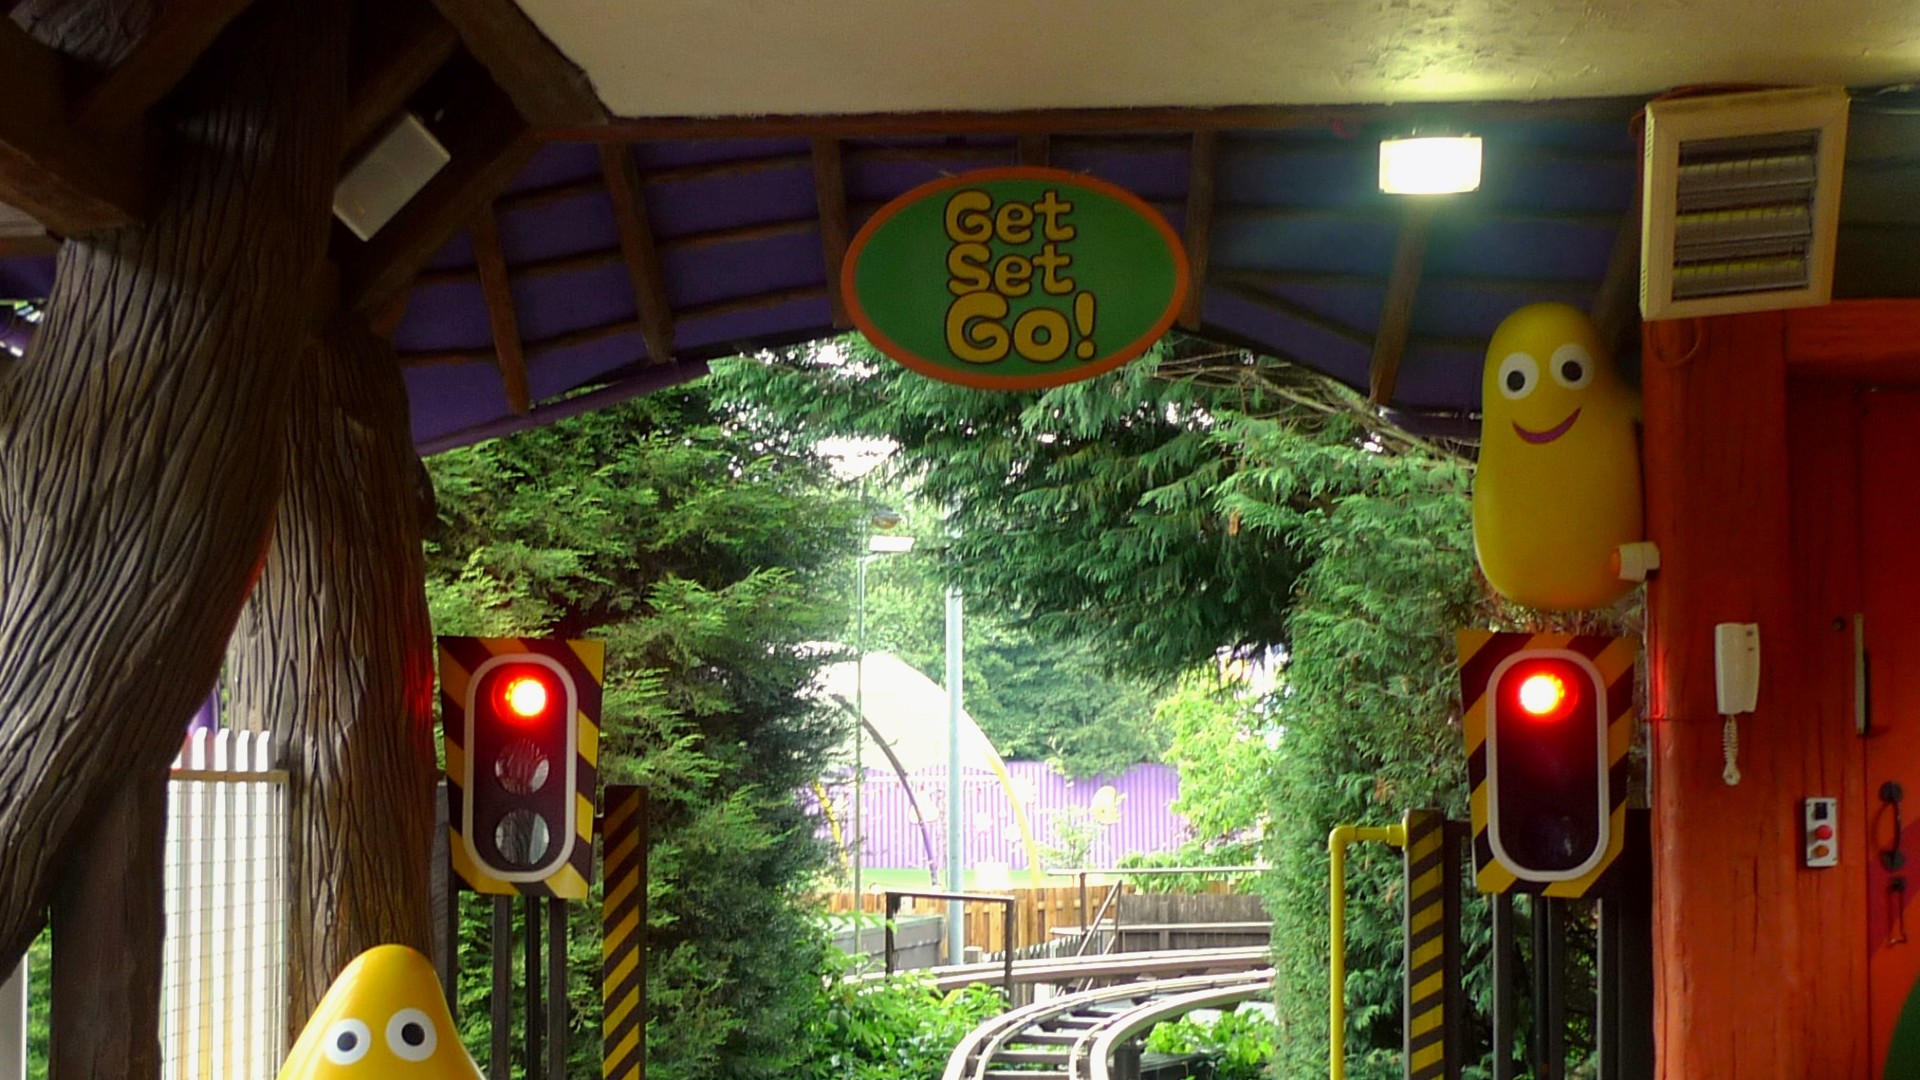
Get Set Go Tree Top Adventure

Get Set Go Tree Top Adventure is an elevated scenic ride above CBeebies Land.

Get Set Go Tree Top Adventure serves as a gentle introduction to CBeebies Land. Families ride in small vehicles above the area, passing bedroom and treetop scenery so younger visitors can take in the world below without the ride ever feeling fast or intense.

Normal 25 min
Average 24 min
Highest measurement 60 min Measured at 25-07 13:17
Type Ride
Category Transport
Photos
RCDB

Coaster profile

Classification

Scale kiddie
Unaccompanied height 3.6 ft (1.1 m)
Opened with CBeebies Land 24 May 2014
Original control Pedal-assisted vehicles

Tracks

Height 13.1 ft (4.0 m)
Speed 3.0 mph (4.8 km/h)
Ride duration 4:00

Trains

Arrangement Kleine verhoogde Tree Top-voertuigen; per voertuig kunnen maximaal 2 rijders mee.
Riders per train 2

Location

The elevated route runs through CBeebies Land. In 2025, part of the original course was removed or rerouted for Bluey the Ride.

Notes

TowersTimes lists Premier Rides, Intelligent Pedal Rail, an opening in 1996 as Squirrel Nutty, a retheme on 24 May 2014, a maximum track height of 13.1 feet, 2 riders per vehicle and a 4:00 ride duration. For the current CBeebies version, the opening date remains 24 May 2014; the original installation and later route changes are kept here as historical context.

Theming

The ride passes the Bugbies and uses its treetop viewpoint to present CBeebies Land as one soft, colourful play world.


Data

Wait statistics

Based on available measurements and historical wait-time data.

Now Closed
Normal 25 min
Average 24 min
Highest measurement 60 min Measured at 25-07 13:17
Measurements 1188
Outage measurements 0
Avg. outage duration -
Often busy 12:00 30 min average
Often quiet 10:00 10 min average
Reliability High 1249 measurements, 7 hour blocks
Distribution

Boxplots

Spread of wait times, outage duration, and the number of outages per day based on available historical data.

Wait times

1188 measurements

0 min 15 min 30 min 45 min 60 min
Min
5 min
Q1
15 min
Median
25 min
Q3
35 min
Max
60 min

Typical wait time: around 25 min.

It usually falls between 15 min and 35 min.

See more than 35 min? It is probably busier than usual — consider a quieter moment.

Less than 15 min? You are in luck: that does not happen often.

Outage duration

Not enough data yet for a boxplot.

This attraction has not reported any outages to us yet. We cannot say anything meaningful about it here.

Outages per day

Not enough data yet for a boxplot.

This attraction has not reported any outages to us yet. We cannot say anything meaningful about it here.

Historical

Wait-time build-up

Today compared with historical wait times by hour.

Today Expected Historical
Horizontal axis hours, vertical axis queue minutes. 0 min 10 min 20 min 30 min 10:00 11:00 12:00 13:00 14:00 15:00 16:00 17:00 18:00