

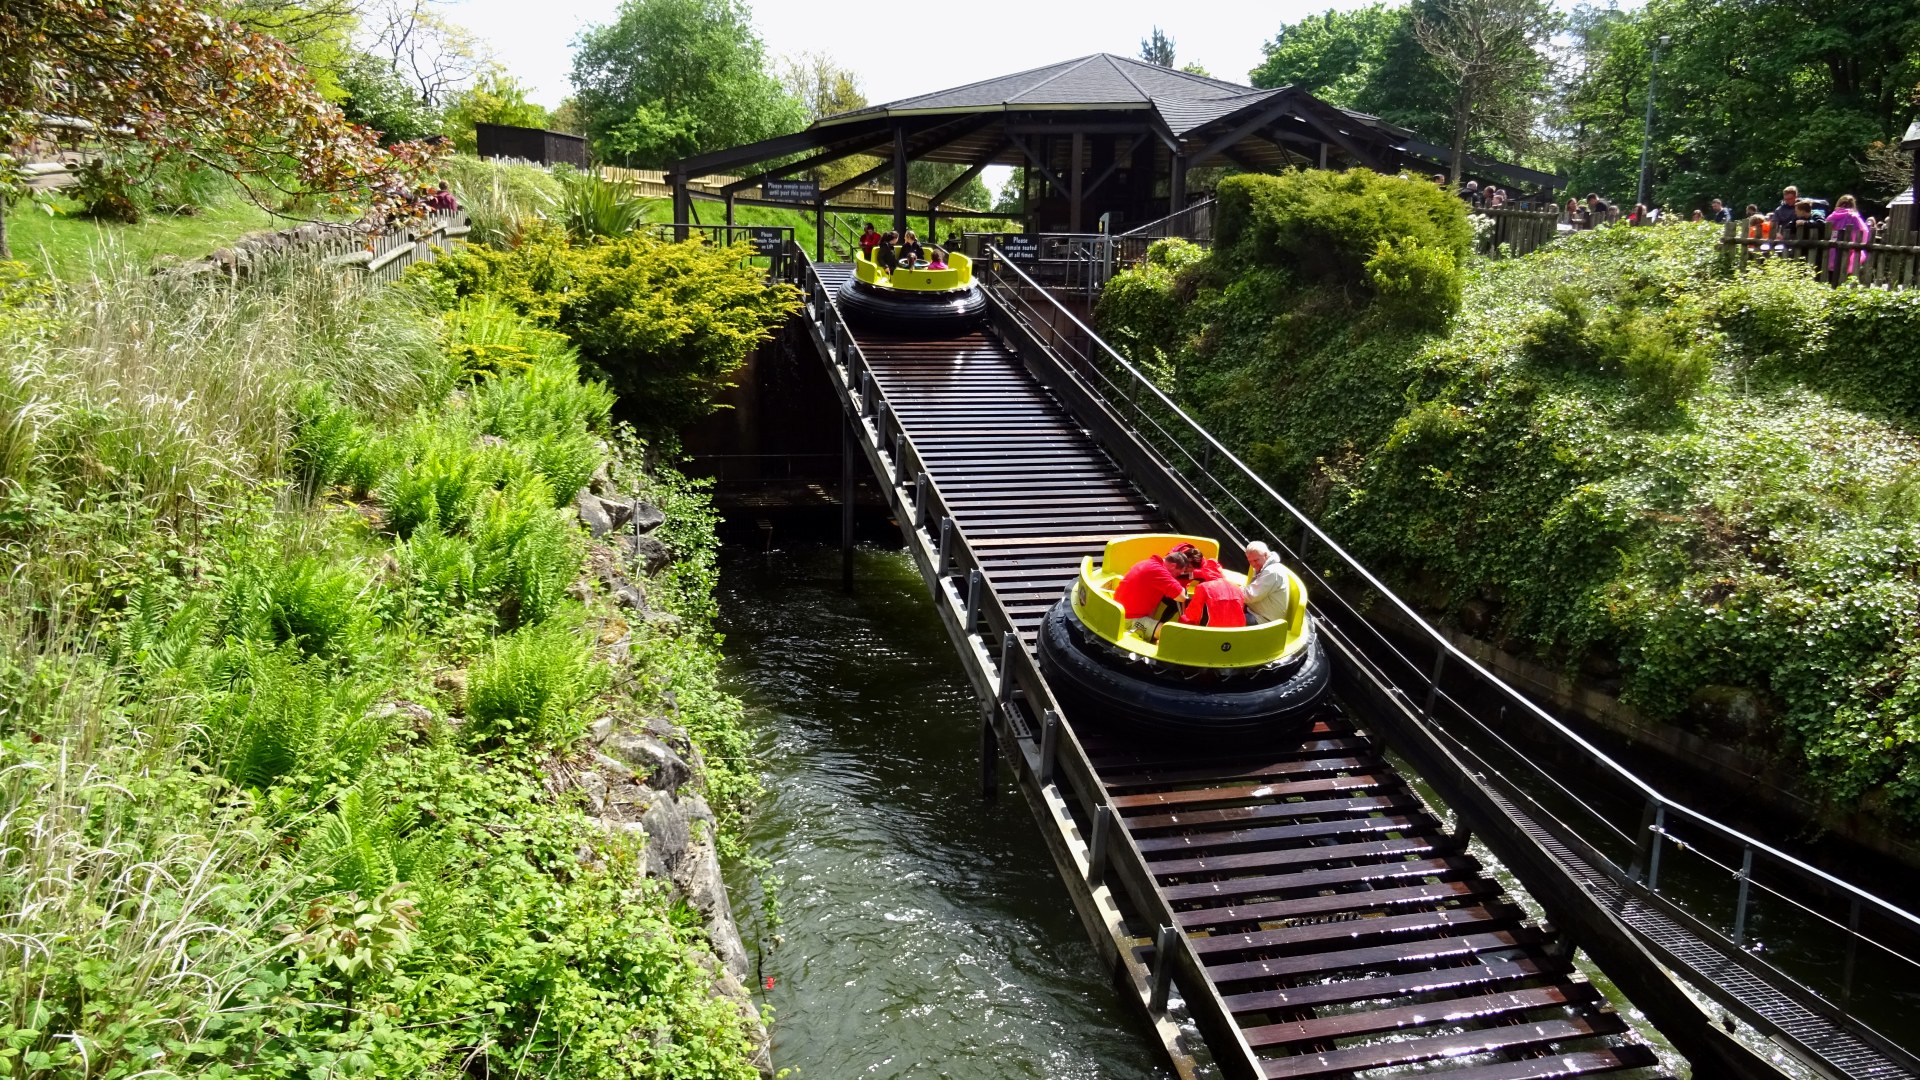
Photo 1 of Congo River Rapids
← Back to Alton Towers
Ride details

Congo River Rapids

Congo River Rapids is Alton Towers' classic Intamin river rapids ride, with a 2,380-foot route through Katanga Canyon.

Congo River Rapids is a wide circular raft ride where the water sets the pace. The boats spin freely with the current, past rockwork, tunnels and waterfalls, so no two laps feel quite the same. It is a family ride, but one where you should expect to get soaked.

Normal 25 min
Average 27 min
Highest measurement 90 min Measured at 09-08 12:01
Type Ride
Category River rapids
Photos
RCDB

Coaster profile

Classification

Scale medium
Former name The Grand Canyon River Rapids
Riders per boat 8
Unaccompanied minimum 130 cm

Tracks

Length 2,378.6 ft (725.0 m)
Ride duration 6:00

Trains

Arrangement 31 ronde rafts; per raft kunnen maximaal 8 rijders mee.
Trains 31
Riders per train 8
Capacity per hour 2,000

Location

Congo River Rapids is in Katanga Canyon and runs close to Runaway Mine Train.

Notes

TowersTimes lists Intamin AG, Rapids Ride, an opening in 1986, a retheme on 31 March 1992, 31 rafts, 8 passengers per raft and a 6-minute ride time. Coasterpedia confirms Intamin, River Rapids, 8 seats per boat and 2,000 riders per hour. Because sources differ on capacity, the existing figure of 2,000 riders per hour remains in place; the ride originally opened as Grand Canyon River Rapids and was renamed Congo River Rapids during the Katanga Canyon retheme.

Theming

A Katanga Canyon attraction with a jungle, river and expedition theme, including tunnel sections and waterfall effects.

Data

Wait statistics

Based on available measurements and historical wait-time data.

Now Closed
Normal 25 min
Average 27 min
Highest measurement 90 min Measured at 09-08 12:01
Measurements 1880
Outage measurements 0
Avg. outage duration -
Often busy 15:00 35 min average
Often quiet 11:00 15 min average
Reliability High 1995 measurements, 8 hour blocks
Distribution

Boxplots

Spread of wait times, outage duration, and the number of outages per day based on available historical data.

Wait times

1880 measurements

0 min 25 min 50 min 75 min 100 min
Min
5 min
Q1
15 min
Median
25 min
Q3
40 min
Max
90 min

Typical wait time: around 25 min.

It usually falls between 15 min and 40 min.

See more than 40 min? It is probably busier than usual — consider a quieter moment.

Less than 15 min? You are in luck: that does not happen often.

Outage duration

Not enough data yet for a boxplot.

This attraction has not reported any outages to us yet. We cannot say anything meaningful about it here.

Outages per day

Not enough data yet for a boxplot.

This attraction has not reported any outages to us yet. We cannot say anything meaningful about it here.

Historical

Wait-time build-up

Today compared with historical wait times by hour.

Today Expected Historical
Horizontal axis hours, vertical axis queue minutes. 0 min 10 min 20 min 30 min 40 min 10:00 11:00 12:00 13:00 14:00 15:00 16:00 17:00