

← Back to Alton Towers
Ride details

Battle Galleons

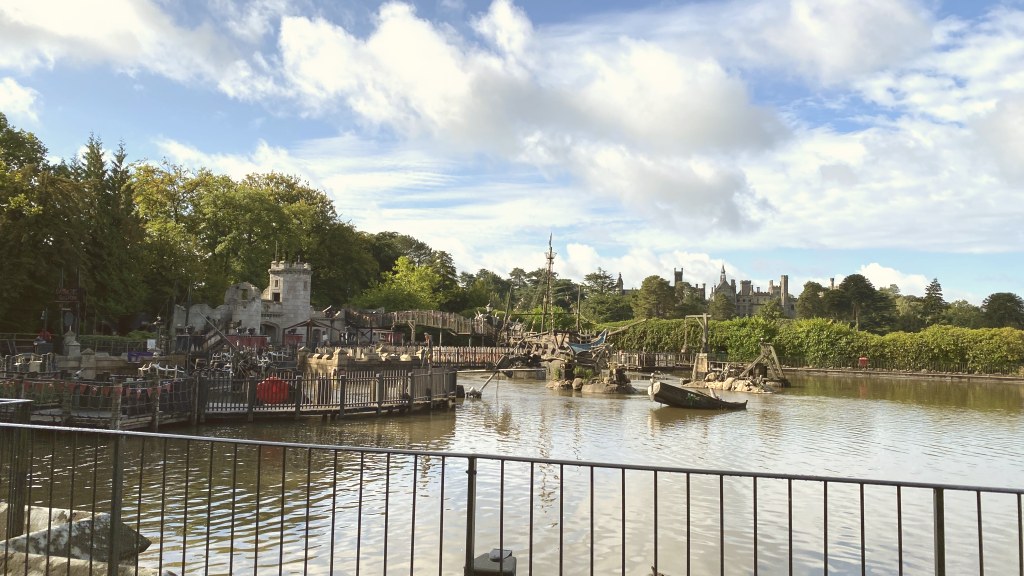
Battle Galleons is an interactive Mack Rides Splash Battle in Mutiny Bay where boats and bystanders soak each other.

Battle Galleons turns a calm boat ride into a full-on water fight. From the galleons, riders aim at targets and rival boats, while people on shore can fire back. It fits Mutiny Bay perfectly: pirate fun, lots of splashing and a ride built for laughing together.

Normal 5 min
Average 8 min
Highest measurement 50 min Measured at 26-06 11:46
Type Ride
Photos
RCDB

Coaster profile

Classification

Scale low
Boats 8
Riders per boat 8
Under 110 cm adult accompaniment required

Tracks

Length 538.1 ft (164.0 m)
Speed 1.9 mph (3.0 km/h)
Ride duration 3:00

Trains

Arrangement 8 Splash Battle-boten; per boot kunnen maximaal 8 rijders mee en elke zitplaats heeft een handbediend waterkanon.
Trains 8
Riders per train 8
Capacity per hour 800

Location

Battle Galleons is located in Mutiny Bay.

Notes

TowersTimes lists Battle Galleons as a Mack Rides Splash Battle that opened in Mutiny Bay on March 15, 2008, with 8 boats, 8 passengers per boat, a capacity of 800 riders per hour and a 3-minute ride duration. Coasterpedia also confirms Mack Rides, the Splash Battle model and the March 15, 2008 opening date. The attraction replaced earlier boat rides on the same lake and revolves around water cannons on the boats and along the shore.

Theming

A pirate and sea battle theme in Mutiny Bay, with interactive water cannons on and around the route.

Data

Wait statistics

Based on available measurements and historical wait-time data.

Now Closed
Normal 5 min
Average 8 min
Highest measurement 50 min Measured at 26-06 11:46
Measurements 1138
Outage measurements 0
Avg. outage duration -
Often busy 14:00 10 min average
Often quiet 11:00 5 min average
Reliability High 1203 measurements, 7 hour blocks
Distribution

Boxplots

Spread of wait times, outage duration, and the number of outages per day based on available historical data.

Wait times

1138 measurements

0 min 15 min 30 min 45 min 60 min
Min
5 min
Q1
5 min
Median
5 min
Q3
10 min
Max
50 min

Typical wait time: around 5 min.

It usually falls between 5 min and 10 min.

See more than 10 min? It is probably busier than usual — consider a quieter moment.

Less than 5 min? You are in luck: that does not happen often.

Outage duration

Not enough data yet for a boxplot.

This attraction has not reported any outages to us yet. We cannot say anything meaningful about it here.

Outages per day

Not enough data yet for a boxplot.

This attraction has not reported any outages to us yet. We cannot say anything meaningful about it here.

Historical

Wait-time build-up

Today compared with historical wait times by hour.

Today Expected Historical
Horizontal axis hours, vertical axis queue minutes. 0 min 5 min 10 min 15 min 20 min 10:00 11:00 12:00 13:00 14:00 15:00 16:00 17:00 18:00